Follow capital across defense, national security and critical technologies. Read the monthly research. Explore the relationships behind it.
287 companies. 856 capital providers. Eleven mission domains.
Explore in 3D ↗︎Watch new relationships and changing domain shares across 24 issues.
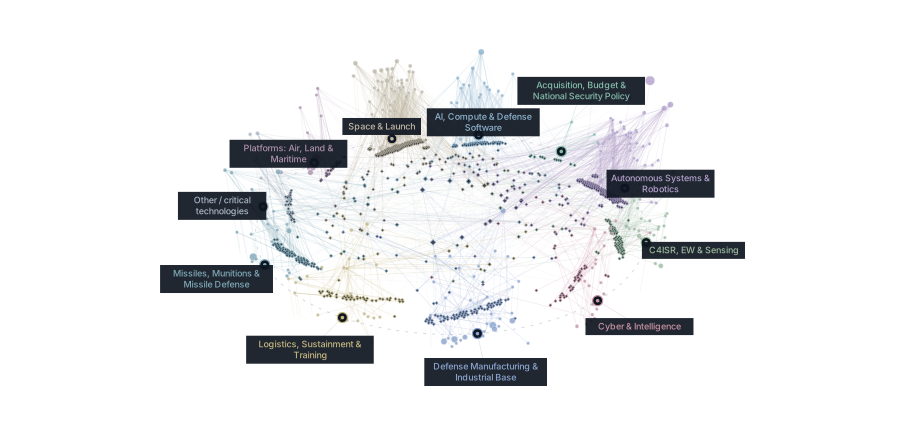 Color = mission domain · Height = disclosed funding
Each month's Pulse in your inbox.
One bar per monthly issue; height is that month's disclosed-dollar floor. Move across the bars for the numbers, click one to open its issue.
Bars show disclosed amounts only. Undisclosed deals add nothing, so every figure reads as "at least".
Deal count or disclosed dollars by mission domain and month, on one scale. Darker means more. Click a month to open that issue. The far-right column is the 24-month total.
| Domain | Sep 24 | Oct 24 | Nov 24 | Dec 24 | Jan 25 | Feb 25 | Mar 25 | Apr 25 | May 25 | Jun 25 | Jul 25 | Aug 25 | Sep 25 | Oct 25 | Nov 25 | Dec 25 | Jan 26 | Feb 26 | Mar 26 | Apr 26 | May 26 | Jun 26 | Jul 26 | Aug 26 | Total |
|---|---|---|---|---|---|---|---|---|---|---|---|---|---|---|---|---|---|---|---|---|---|---|---|---|---|
| Missiles, Munitions & Missile Defense | – | 1 | 1 | 1 | 1 | – | 2 | 2 | 2 | 1 | – | – | 1 | 1 | 1 | 1 | 2 | 3 | – | 3 | 3 | 4 | 2 | 6 | 38 |
| Autonomous Systems & Robotics | 5 | 1 | 3 | – | 2 | 1 | 1 | 3 | 5 | 2 | 5 | 3 | 2 | 4 | 5 | 1 | 2 | 3 | 3 | 4 | 2 | 1 | 3 | 5 | 66 |
| Space & Launch | 1 | 1 | 2 | – | 2 | 3 | 2 | 4 | 4 | 4 | 1 | 3 | 2 | 2 | 2 | 5 | 2 | 5 | 4 | 3 | 5 | 5 | 1 | 1 | 64 |
| C4ISR, EW & Sensing | 3 | 1 | 2 | – | 1 | 2 | 1 | – | 4 | 2 | 3 | – | 1 | 1 | 1 | 2 | – | 1 | 1 | 2 | 2 | 2 | 1 | 5 | 38 |
| Cyber & Intelligence | 1 | 1 | – | 2 | – | 2 | 2 | 1 | 2 | 1 | – | – | 1 | – | 1 | – | 2 | 1 | – | 1 | – | 1 | 2 | 1 | 22 |
| AI, Compute & Defense Software | 2 | – | – | 2 | 1 | – | 1 | – | 5 | 5 | 2 | 1 | 1 | – | – | – | 2 | – | 1 | 1 | 2 | – | 2 | 1 | 29 |
| Platforms: Air, Land & Maritime | – | – | – | 1 | – | – | – | 1 | – | – | 3 | – | – | – | – | – | 2 | 1 | – | 1 | – | 1 | 1 | 2 | 13 |
| Defense Manufacturing & Industrial Base | – | 1 | – | 1 | 1 | 2 | 1 | 1 | 1 | 1 | 3 | 3 | – | – | 3 | 1 | 3 | 2 | 2 | 2 | 2 | 4 | 2 | 1 | 37 |
| Logistics, Sustainment & Training | – | 1 | – | – | – | 1 | – | 1 | 5 | 1 | 4 | 1 | – | – | – | – | 2 | 1 | 1 | 1 | – | 1 | 2 | – | 22 |
| Acquisition, Budget & National Security Policy | – | – | – | – | – | – | – | – | 1 | 1 | – | – | – | 1 | – | – | – | 1 | – | – | – | – | – | – | 4 |
| Other / critical technologies | – | 1 | – | – | – | – | – | 2 | – | 1 | 1 | – | – | – | 1 | 1 | – | – | 1 | – | – | – | – | – | 8 |
| Domain | Sep 24 | Oct 24 | Nov 24 | Dec 24 | Jan 25 | Feb 25 | Mar 25 | Apr 25 | May 25 | Jun 25 | Jul 25 | Aug 25 | Sep 25 | Oct 25 | Nov 25 | Dec 25 | Jan 26 | Feb 26 | Mar 26 | Apr 26 | May 26 | Jun 26 | Jul 26 | Aug 26 | Total |
|---|---|---|---|---|---|---|---|---|---|---|---|---|---|---|---|---|---|---|---|---|---|---|---|---|---|
| Missiles, Munitions & Missile Defense | – | $3M | $4.1B | $31M | $100M | – | $280M | $90M | $165M | $100M | – | – | $60M | $30M | $100M | $350M | $1B | $66M | – | $875M | $5.08B | $2.06B | $171M | $1.8B | ≥$16.46B |
| Autonomous Systems & Robotics | $161M | $15M | $257M | – | $957M | $600M | $240M | $150M | $334M | $2.51B | $53M | $237M | $191M | $165M | $535M | $60M | $215M | $277M | $3.86B | $247M | $130M | $567M | $2.25B | $277M | ≥$14.29B |
| Space & Launch | $5M | $150M | $335M | – | $430M | $157M | $75M | $703M | $376M | $636M | $187M | $907M | $253M | $1.36B | $818M | $3.18B | $945M | $1.07B | $1.07B | $235M | $760M | $1.55B | $500M | – | ≥$15.71B |
| C4ISR, EW & Sensing | $1.28B | – | $855M | – | – | $71M | $25M | – | $4.72B | $1.16B | $14M | – | – | $20M | $510M | – | – | $14M | $5M | $15M | $245M | $820M | – | $1.91B | ≥$11.67B |
| Cyber & Intelligence | $55M | – | – | $800M | – | $123M | $85M | $18M | $320M | $25M | – | – | $75M | – | $26M | – | $375M | – | – | $18M | – | $100M | $30M | – | ≥$2.05B |
| AI, Compute & Defense Software | $70M | – | – | $51M | $50M | – | $28M | – | $112M | $1.49B | $161M | $3M | $125M | – | – | – | $336M | – | $80M | $100M | $231M | – | $2.25B | $61M | ≥$5.15B |
| Platforms: Air, Land & Maritime | – | – | – | $430M | – | – | – | – | – | – | $3.77B | – | – | – | – | – | $1.72B | $28M | – | $350M | – | $272M | $3.45B | $890M | ≥$10.92B |
| Defense Manufacturing & Industrial Base | – | $12M | – | $10M | $3.6B | $3B | – | – | $8M | $25M | $298M | $83M | – | – | $3.65B | $1.8B | $100M | $132M | – | $25M | $2.85B | $577M | $65M | $1.37B | ≥$17.6B |
| Logistics, Sustainment & Training | – | $30M | – | – | – | $6M | – | $15M | $231M | – | $50M | $6M | – | – | – | – | – | $34M | – | – | – | $105M | $370M | – | ≥$847M |
| Acquisition, Budget & National Security Policy | – | – | – | – | – | – | – | – | $3M | $7M | – | – | – | $150M | – | – | – | $17M | – | – | – | – | – | – | ≥$177M |
| Other / critical technologies | – | $59M | – | – | – | – | – | $160M | – | $35M | $400M | – | – | – | $130M | $300M | – | – | $450M | – | – | – | – | – | ≥$1.53B |
A quiet row is a quiet market, not a missing page.
Each monthly issue lists the announced and closed financings, acquisitions and public-market events in our scope. Every line has the date, the disclosed amount, the investors or acquirer, the mission domain the capital is buying and a link to the source. Fund closes and government capital programs sit in sidebars, outside the statistics. It is a map of public activity, not investment advice.
Ten operating domains plus Other / critical technologies. Each event gets one primary domain: the market the money is buying, not the investor's brand or the company's tagline.
Events sit in the month they were first announced in public. A later close does not move an event into a later month's counts.
Dollar totals add up only what was publicly disclosed. Undisclosed stays blank. We do not fill blanks with zeros, so every total means "at least this much."
Deal databases are for searching. The Pulse is for reading: one map of where defense and national security capital went last month, dated to first announcement, clear about what was not disclosed and sorted by the markets investors underwrite. Abelian Security Council publishes it because the investors and operators who need this picture are the same people our network serves.
ASC connects you with the people who researched, designed, built, evaluated, bought, deployed or competed with the systems you are underwriting. Start with For Clients. If you are one of those people, start with For Members.
Industrial-scale checks and a crowded strategic calendar: Hadrian's $1.37B, TTM's $1.1B for Epiq, Castelion's $1.05B package, and three public-market debuts. Missiles and sensing both hit their highest monthly counts in the archive.
22 events · disclosed floor ≥$6.31B · 8 M&A. Inside: headline read, heat map, top deals, movers, sidebars and domain detail.
No. It is a list of announced and closed financings, M&A and public-market events inside our coverage scope. Markets with thin disclosure, and activity outside that scope, will look light. Sponsor add-ons often have no disclosed price. Treat it as a baseline, not a census.
By announcement date. Issue-month statistics use the first public announcement, and a close in a later month does not move the event. Purchase options and contingent exclusives may appear in the narrative but are excluded from counts and floors.
We record the headline amount as reported, then flag packages that mix equity with credit, earnouts or large IPO secondary components in each issue's Method notes. An equity-only reading can be lower than the disclosed floor.
Deal count or disclosed dollars. On this page, it is absolute activity across 24 months, and you can toggle between the two. Inside each issue, it is activity against that domain's own recent baseline. A quiet row means little activity, not missing data.
From the ten mission domains ASC covers, which follow how investors underwrite the sector, plus an Other row for in-scope critical technologies that do not fit one domain. Each event is placed by what the capital is buying.
Investors, operators and advisors who track defense, national security and critical technologies. If you need the people behind these deals, start with For Clients or For Members.
Platforms, policy and Other show up less often than the rest of the map. That is how those markets trade, not a hole in the archive.
Few events, but large ones. Carve-outs and strategic acquisitions above $1.5B dominate the row. Platform businesses change hands rarely and in size, and we may also be missing smaller transactions.
Fewer than 12 named deals in 24 months. Equity and M&A are rare here by nature. Budget and policy moves happen outside the deal list. Read the row as a placeholder for a market that mostly does not transact.
In-scope critical-technology events that do not fit one mission domain: advanced nuclear (Valar Atomics, Radiant), rare earths (MP Materials), quantum software (Q-CTRL, SandboxAQ) and biosecurity (Portal Biotech).
Start with Aug 2026 and work back. Each issue has a headline read, heat map, top deals, movers, sidebars, domain detail and a full deal table with sources.
Disclaimer. Compiled from public sources. Figures may be incomplete or restated as better primary sources appear. Undisclosed amounts are excluded from dollar totals. This archive is for informational purposes only and is not investment advice, an offer, or a solicitation.